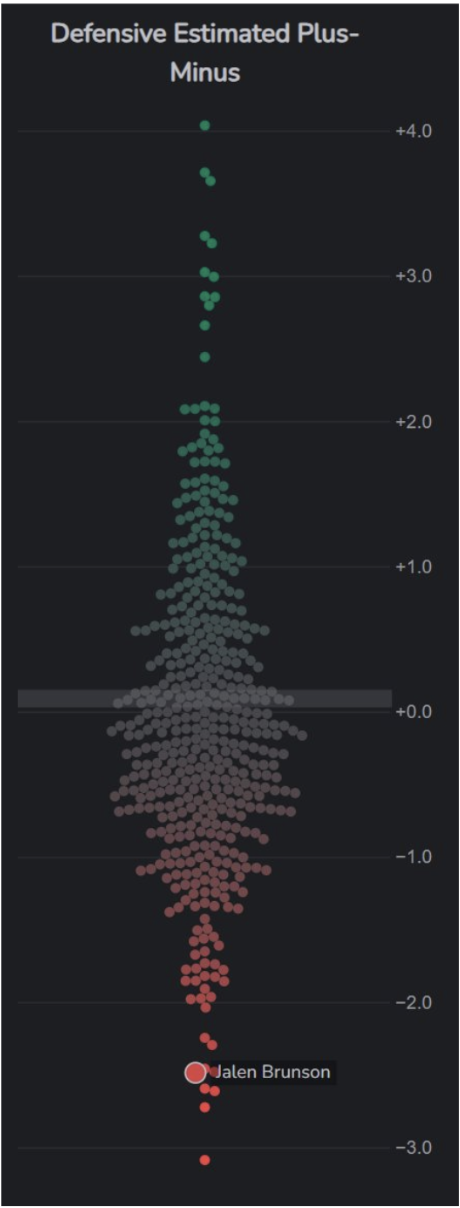
Figure 1.2 — D-EPM estimates points added/cost per 100 possessions on defense. The 0.0 line is league average; Brunson sits around -2.5, indicating significant negative impact.
Interpretation
A placement near -2.5 suggests when Brunson is on court the team allows ~2.5 more points per 100 possessions than average. This supports the conclusion that Brunson’s defensive impact is below league average; consider interactive exploration by lineup to see partner effects.
Source
Source: Knicks analytics / public visualizations.